What is Chart Go?
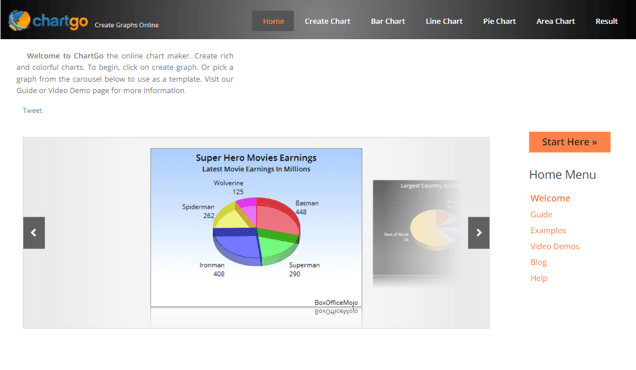
Chart Go is an online charting service that simplifies the process of creating and customizing charts, graphs, and diagrams. Whether your data is simple or complex, Chart Go allows you to effortlessly generate visuals that meet your specific requirements. It offers a wide range of powerful tools that enable you to personalize your charts by adding text, images, and animations. With Chart Go, you can achieve professional-looking results in a short amount of time, making it a valuable tool for businesses, teachers, and students. Its user-friendly drag-and-drop interface allows you to quickly build visually appealing graphics with minimal effort. Additionally, Chart Go allows you to easily share your creations in various formats, including PDF, PNG, and SVG. Rest assured, Chart Go prioritizes the security of your data, ensuring it remains safe and protected. By utilizing Chart Go, you can swiftly create eye-catching visuals that captivate your audience.
Information
- Price
- Contact for Pricing
Freework.ai Spotlight
Display Your Achievement: Get Our Custom-Made Badge to Highlight Your Success on Your Website and Attract More Visitors to Your Solution.
Website traffic
- Monthly visits43.84K
- Avg visit duration00:06:34
- Bounce rate36.81%
- Unique users--
- Total pages views233.26K
Access Top 5 countries
Traffic source
Chart Go FQA
- How can I create graphs online?

- What types of graphs can I create?

- Can I use my excel file to create a chart?

- Can I use my CSV file to create a chart?

- What types of charts can I create for investments?

Chart Go Use Cases
Create rich and colorful charts
Create different chart types including bar graphs, line graphs, and pie charts
Use excel file to create a chart
Use CSV file to create a chart
Simple and easy to use
Create stock charts, forex charts, or any type of investment chart
Engage students with vibrant and colorful charts
Create professional charts
Generate growth stocks and trade charts
Contact us for any questions
