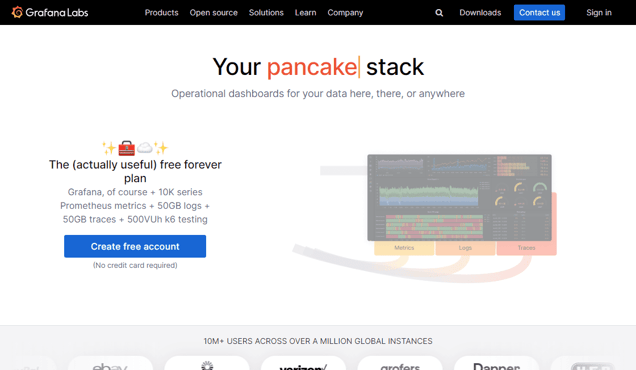
What is Grafana?
Grafana is a popular open source platform designed for analytics and monitoring purposes. It enables users to effectively visualize data and track performance metrics. By utilizing Grafana, users can effortlessly create dashboards and charts to conveniently monitor their applications, systems, and infrastructure. This platform offers robust features that provide users with in-depth insights into their data, such as advanced alerting and notifications, seamless integration with various data sources, and flexible customization options. With Grafana, users can monitor their data in real-time and promptly identify potential issues. It proves to be an excellent tool for developers, DevOps engineers, and IT professionals who need to stay updated on the status of their applications and infrastructure. Moreover, Grafana provides an extensive range of APIs and SDKs, allowing users to effortlessly integrate their data into the platform and create customized visualizations. By utilizing Grafana, users can gain invaluable insights from their data, enabling them to make well-informed decisions.
Information
- Price
- Contact for Pricing
Freework.ai Spotlight
Display Your Achievement: Get Our Custom-Made Badge to Highlight Your Success on Your Website and Attract More Visitors to Your Solution.
Website traffic
- Monthly visits1.53M
- Avg visit duration00:04:55
- Bounce rate44.99%
- Unique users--
- Total pages views7.27M
Access Top 5 countries
Traffic source
Grafana FQA
- What are the deployment options for Grafana?

- What are the products offered by Grafana?
- What are the features of Grafana Cloud?
- What are the open source projects supported by Grafana?
- What resources are available for learning Grafana?
Grafana Use Cases
Grafana Cloud Logs powered by Grafana Loki
Grafana for visualization
Grafana Cloud Traces powered by Grafana Tempo
Grafana Cloud Metrics powered by Grafana Mimir and Prometheus
Grafana Plugins - Connect Grafana to data sources, apps, and more
Frontend Observability - Gain real user monitoring insights
Incident Response & Management with Grafana Alerting, Grafana Incident, and Grafana OnCall
Performance testing powered by Grafana k6
Continuous profiling powered by Grafana Pyroscope
Grafana Cloud - Fully managed