What is Prometheus?
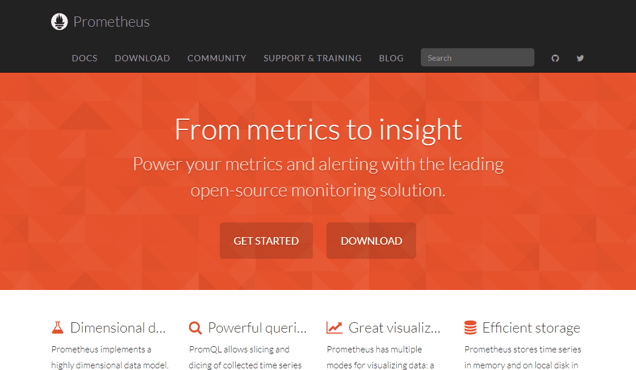
Prometheus is a powerful open-source monitoring and alerting system specifically designed to optimize software applications. By utilizing Prometheus, software developers can effectively monitor the real-time performance of their applications and promptly detect any potential issues. This system also enables developers to create automated alerts that promptly notify them when certain performance thresholds are exceeded. This proactive approach ensures that problems are swiftly addressed, guaranteeing efficient and seamless application performance. Furthermore, Prometheus offers an intuitive dashboard that provides comprehensive insights into application performance, simplifying the identification and diagnosis of any potential problems. With Prometheus, developers can effortlessly monitor their applications and ensure optimal functionality.
Information
- Price
- Contact for Pricing
Freework.ai Spotlight
Display Your Achievement: Get Our Custom-Made Badge to Highlight Your Success on Your Website and Attract More Visitors to Your Solution.
Website traffic
- Monthly visits431.84K
- Avg visit duration00:03:05
- Bounce rate56.64%
- Unique users--
- Total pages views1.09M
Access Top 5 countries
Traffic source
Prometheus FQA
- What are the key features of Prometheus?

- What is the licensing of Prometheus?

- Which organizations use Prometheus?

- What is the data model used by Prometheus?

- What are the storage options in Prometheus?

Prometheus Use Cases
Use case 1: Monitoring system statistics
Use case 2: Monitoring Docker metrics
Use case 3: Monitoring HAProxy metrics
Use case 4: Monitoring JMX metrics
Use case 5: Generating ad-hoc graphs
Use case 6: Generating tables
Use case 7: Generating alerts based on metrics
Use case 8: Instrumenting services with client libraries
Use case 9: Bridging third-party data into Prometheus
Use case 10: Visualizing data with Grafana integration
Use case 11: Storing time series data efficiently
Use case 12: Independent server operation for reliability
